The Population Mobility Monitor (PMM)
The Population Mobility Monitor (PMM) is an experimental data management and interactive visualisation tool for showing realised mobility flows based on digital data sources. The tool enables to understand the spatiotemporal dynamics of human mobility and thus supports public authorities, transport service providers, and other interested parties in their decision-making. The tool can be accessed here: https://mara.ut.ee/
The proof-of-concept tool is developed by the Mobility Lab at the University of Tartu, Estonia, and as an open-source software, it is available for further development and replication. The code is accessible from the repository of the Mobility Lab at https://gitlab.ut.ee/public-pmm
Read more...
- The commuting patterns between spatial units,
- The temporal flows of people from hourly to seasonal rhythms,
- The general demand for transportation,
- The share of travel modes used,
- The potential number of users for alternative travel modes or travel times.
Pilot Cases
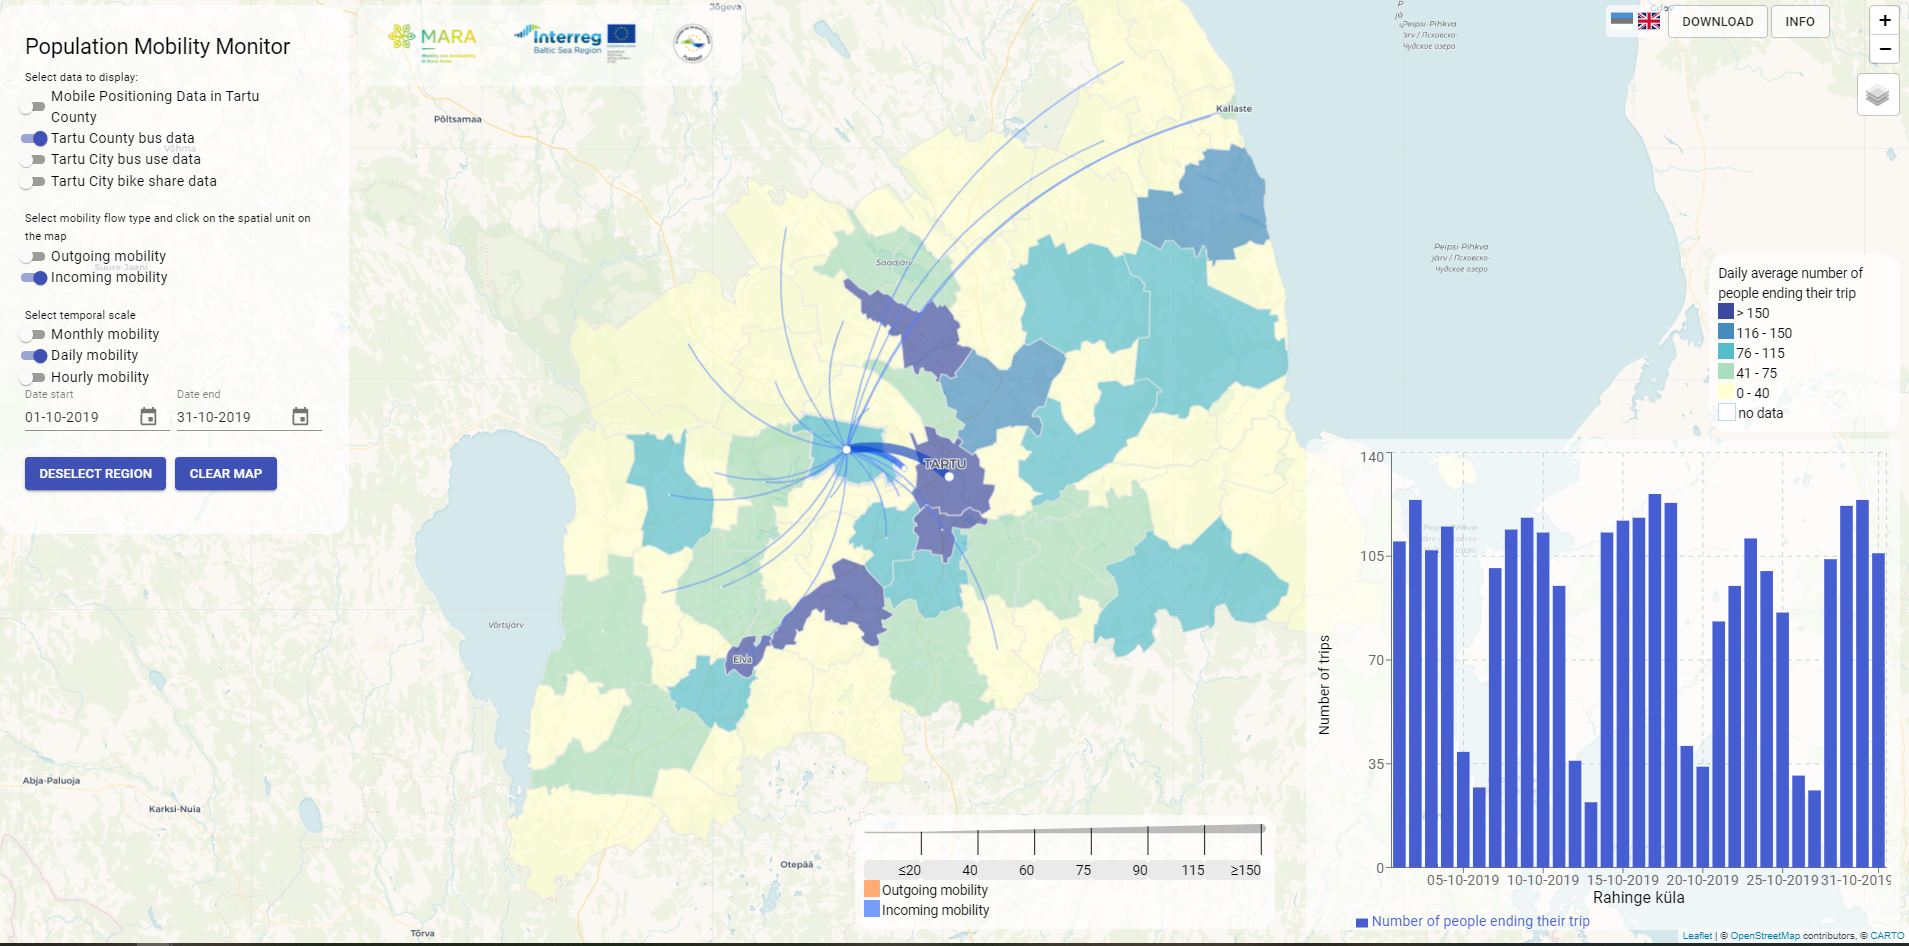
In the Tartu pilot area, the anonymous mobility data are aggregated to origin-destination flows at two spatial scales: at the neighbourhood level in urban setting and at the level of the territorial units in sparsely populated areas. The temporal accuracy of the data ranges from hourly flows to monthly statistics.
The mobility data used for PMM represents four different data sources: a) Daily regular movements in Tartu county based on passive mobile positioning data extrapolated to the whole population; b) Tartu county bus ticketing data; c) Tartu city bus ticketing data; d) Tartu city bike share data. The data are available for fixed periods without real-time updates.
Population Mobility Monitor for Tartu and its surroundings is available here: https://mara.ut.ee/
Ludwigslust-Parchim, Germany
In the Ludwigslust-Parchim case area, the tool applies the spatial units of local municipalities for visualising the mobility flows. The temporal resolution is on hourly and daily level from an average statistical winter weak from November based on years 2018 and 2019.
The data used for PMM is based on anonymised mobile network signalling data provided by Motionlogic GmbH. It includes movement inside the area and movements starting or ending in the study area. The results are extrapolated to entire population using different reference data sources (e.g., census) by Motionlogic GmbH.
Population Mobility Monitor for Ludwigslust-Parchim case area is available here: https://pmm.vlp.info/
Recommendations to adopt the tool in other regions
In order to apply PMM in your region, please consider the following aspects.
- What kind of digital mobility data exists in your region that could be used in the tool? Suitable data sets may be public transit smart card data, trip data from bike-sharing systems, mobile phone data, GPS data, taxi data, etc. You may use either one or several data sets. Using several data sets comparatively gives you unique opportunities to analyse and visualise the mobility patterns in your region.
- Is the data processed to origin-destination matrix format? The PMM uses origin-destination data matrices as input. If you have access to another kind of data, which can be used for preparing origin-destination matrices, it can also be applied. E.g., if you have bus validation data only at the entry level, it needs to be processed to the origin-destination level. Depending on the available data type, different data processing steps need to be carried out. Data, which cannot be processed to the origin-destination level, need to be omitted. Please note that both the input and output data of the tool are aggregated and anonymous, and no individual data must be revealed by the tool.
- What is the appropriate spatial aggregation level of mobility data that you can use in your region? Depending on the spatial context spatial reference data and reference system should be chosen. You may use administrative, postal code, or grid-based aggregation of spatial data. Administrative units may range from neighbourhoods to local communities, for example. The chosen spatial units need to make sense for your own use case, such as for transport planning or local level statistics. If you use several input data sets and wish to visualise them comparatively, they need to be formatted to the same structure and it is important that a common spatial reference is chosen.
- What is the appropriate temporal aggregation level matching your data sets? It depends on the granularity of your input data sets, and whether you want to present them comparatively or separately. Typically, origin-destination data sets are arranged either on hourly, daily, monthly, or even annual level.
- What kind of additional information is needed? The focus of interest can vary in different regions, e.g., it might be important to also visualise population density, bus stops, bicycle roads, points of interest etc.
- What are the technical possibilities and preferences to adopt the tool in your region? Software developer competence is needed for adoption. You need to decide how and where to host the database and user interface of the tool. The PMM is currently developed in Python language, and requires a spatial database (e.g., PostgreSQL 10 or higher), with a PostGIS (tested on 2.5) extension which allows Geographic Information Systems (GIS) objects to be stored in the database. The web map runs on Node.js platform.
Partner implementing this tool:
